
The Future of Obesity Treatment: LHCGR as a Novel Target for Obesity Medications.
Outlining my research at Mount Sinai on how LHCGR, a receptor found in fat tissue, affects body fat distribution and its potential to revolutionize our approach to obesity treatment.

This article is a bit different from the others. It is actually detailing research I did over the course of 3 years at the center for translational medicine and pharmacology at Mount Sinai.
What is Obesity?
Obesity is a disease around abnormal or excessive fat accumulation that presents a risk to health. More than 1/3 of U.S. adults are affected by obesity and over 800 million people are worldwide. Almost 50% of U.S. adults are expected to be obese by 2030. Obesity significantly increases the risk of numerous comorbidities, including cardiovascular disease, type 2 diabetes, and certain cancers, contributing to approximately 4.7 million deaths annually, and accounting for 8% of global mortality.
Obesity was first recognized as a disease in 1948 by the World Health Organization (WHO), yet it took until 2013 for the American Medical Association (AMA) in the United states to recognize obesity as a disease. This recognition is incredibly important. Obesity for a while, and still, has been seen as an individual’s fault: eating too much and moving too little. And while these factors can certainly contribute to obesity, obesity is caused by an interplay of genetics and ones lifestyle choices.
Body mass index (BMI) has been the standard measure of obesity:
$$ weight(kilograms)/height^2(meters) $$
Someone with BMI of 30 or higher is considered to be obese, yet this marker has its limitations; it is not a definitive indicator of wether someone has obesity or not. Yet, when we talk about obesity, the conversation almost always begins and ends with the scale. The underlying assumption for decades was simple: if obesity is an excess of fat, then the solution must be to reduce overall weight. Doctors measure weight, calculate body mass index (BMI), and use those numbers to assess health risk. This logic gave rise to treatments focused narrowly on calorie balance, appetite suppression, or fat absorption. These tools are simple and standardized, but they overlook something critical: where fat is stored in the body matters more than how much of it there is.
Rethinking Obesity
Two people can have the same BMI and look similar on paper, yet carry very different health risks. The reason is that fat is not all alike—it exists in different compartments, and those compartments behave in very different ways.
Subcutaneous fat is the soft layer under the skin which can be pinched. It serves as an energy source, helps insulate the body, protects tissues, and supports nerves and blood vessels. It is often metabolically neutral or even protective.
Visceral fat is the fat packed deep inside the abdomen, surrounding the liver, pancreas, and intestines. Unlike subcutaneous fat, it is biologically active. It constantly releases fatty acids and inflammatory molecules into the bloodstream, especially into the liver through what is called the portal vein. This process disrupts sugar regulation, raises cholesterol and triglyceride levels, and promotes high blood pressure.
It is visceral fat, not simply total body fat, that drives the cascade of complications we associate with obesity—type 2 diabetes, cardiovascular disease, fatty liver disease, and more.
Other markers for obesity include waist circumference, and waist-to-hip ratio (WHR), with WHR emerging as the most precise predictor of metabolic health and disease risk. Because visceral fat increases waist size while subcutaneous fat in the hips and thighs balances it out, WHR has emerged as the best simple measure of fat distribution. It is calculated by dividing waist circumference by hip circumference. A higher ratio means proportionally more abdominal fat.
Large-scale studies, including those involving hundreds of thousands of participants, consistently show that WHR is more predictive of long-term health outcomes and mortality than BMI. In other words, knowing someone’s waist-to-hip ratio tells us far more about their likelihood of developing diabetes, heart disease, or dying prematurely than knowing their BMI alone. This finding has been replicated across populations and ethnic groups, and it holds true even when BMI is within “normal” ranges.
The implications are profound: if our true goal is to reduce the diseases and deaths linked to obesity, treatments must do more than lower weight or BMI—they must also improve fat distribution. A lower WHR, reflecting less visceral fat and proportionally more subcutaneous fat, is what truly protects against long-term metabolic harm.
GLP-1 receptor agonists - a class of type 2 diabetes drugs that not only improve blood sugar control but may also lead to weight loss — have long been the standard for obesity medication. Patients on GLP-1 therapies often see dramatic reductions in total body weight, and for many, this is life-changing. GLP-1 agonists, like Ozempic, work by mimicking a natural hormone called glucagon-like peptide-1 (GLP-1) in the body. This hormone helps regulate blood sugar levels and promotes feelings of fullness. By activating GLP-1 receptors in the brain and gut, these medications suppress appetite, increase satiety, and slow down gastric emptying, leading to reduced food intake and weight loss.
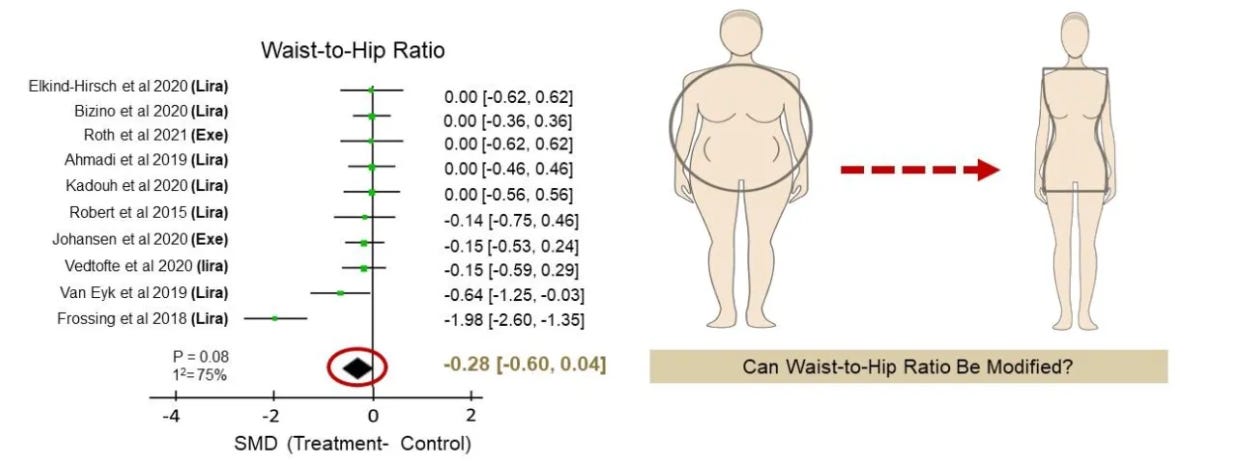
But here is the limitation: despite their success on the scale, GLP-1 agonists do not reliably change WHR. A 2023 meta-analysis of ten randomized controlled trials found that while patients on GLP-1 drugs lost substantial weight—including some visceral fat—their WHR remained largely unchanged. That means the most dangerous pattern of fat distribution, centered in the abdomen, persisted.
This matters because it helps explain why losing weight does not always translate into the expected reductions in cardiovascular risk. If the distribution of fat remains unfavorable, the metabolic risk remains high.
In short, today’s most effective weight-loss drugs shrink fat mass, but they do not solve the fat distribution problem. What is needed is a therapy that doesn’t just make people lighter, but makes them metabolically healthier by reshaping where fat is stored. There is currently an unmet need for obesity treatments targeting WHR.
Waist-to-hip ratio is not only a predictor of metabolic health—it is also a long-recognized marker of reproductive fitness. Anthropologists and evolutionary biologists have studied WHR for decades, and across cultures, it is strongly correlated with fertility, reproductive success, menstrual cycle length, and the timing of menopause.
How is reproduction related to fat distribution?
Reproductive processes are tightly linked to hormones, many of which also influence metabolism. Estrogen, for example, promotes fat storage in the hips and thighs, which lowers WHR. During menopause, as estrogen levels decline, fat distribution shifts toward the abdomen, raising WHR and increasing visceral fat. This transition is one reason post-menopausal women often experience a surge in metabolic risk, even without major changes in weight.
Beyond menopause, conditions such as polycystic ovary syndrome (PCOS) provide additional clues. PCOS is characterized by abnormal secretion of reproductive hormones, particularly luteinizing hormone (LH), and women with PCOS frequently show higher waist-to-hip ratios and central obesity. Similarly, altered patterns of LH secretion during the menopausal transition are linked to changes in both BMI and WHR. These associations suggest that reproductive hormones—and especially LH—play a meaningful role in determining how fat is distributed in the body.
A Hormone at the Center: Luteinizing Hormone (LH)
Among the reproductive hormones, LH stands out. LH is produced in the pituitary gland, a small but powerful organ at the base of the brain that coordinates many of the body’s hormone systems. In women, LH triggers ovulation and stimulates the ovaries to produce estrogen and progesterone. In men, LH signals the testes to produce testosterone.
But there is reason to believe LH does more than control reproduction. Some large population studies have shown correlations between LH levels and body composition, suggesting that LH may also act as what researchers call a “pro-lean hormone”—a hormone that reduces fat storage and increases energy expenditure. The idea that a reproductive hormone could double as a regulator of fat metabolism opens a fascinating possibility: could the receptor for LH be a new target for obesity treatment?
For LH to have an effect, it needs to bind to its protein receptor. That receptor is called LHCGR (luteinizing hormone/choriogonadotropin receptor). LHCGR is part of a family of proteins known as G protein-coupled receptors (GPCRs). GPCRs sit on the surface of cells and act like molecular switches: when a hormone or chemical binds to them, they trigger a cascade of signals inside the cell that change how the cell behaves.
Traditionally, LHCGR is thought to exist only in reproductive tissues—the ovaries and testes. There, it drives the production of sex hormones and controls fertility. But if LHCGR were also found in fat tissue, it would mean that LH could directly influence fat metabolism, bridging the gap between reproduction and obesity.
Finding this out would be incredibly significant because we currently can’t change the genetic factors that influence waist-to-hip ratio (WHR), and lifestyle factors like exercise and diet often fail in the long run because people struggle to stay consistent. Reproductive factors are our last hope. Specifically, targeting the expression of a receptor could provide a way to modify WHR, and this approach could realistically be used in a pharmacological setting.
In summary, the history of obesity and its treatments shows two things clearly:
Reducing weight is not enough. Treatments must also improve the quality and distribution of fat.
Reproductive hormones may hold the key. Observations from menopause, PCOS, and fertility research all point to hormones like LH influencing fat distribution.
This hypothesis—that LHCGR is present in human fat, helps regulate fat distribution, and play a role as a reproductive determinant of WHR—is what motivated our research. To test it, we needed to proceed step by step:
Confirm whether LHCGR is actually present in human fat cells.
Investigate whether genetic variation in LHCGR is linked to differences in waist-to-hip ratio.
Test whether activating LHCGR changes fat distribution in experimental models.
Each step required a different set of tools, from genetics to microscopy to animal studies. Together, our study built a case for reimagining LHCGR not just as a fertility receptor, but as a novel therapeutic target for obesity.
Step 1 — Is the LH receptor (LHCGR) actually in human fat?
If LHCGR isn’t present in adipose tissue, there’s no plausible way for LH signaling to directly reshape fat distribution. So the first thing we had to establish—beyond any doubt—was cellular presence: does LHCGR show up in human fat, and in which cells?
To answer that convincingly, we used orthogonal (independent and complementary) approaches:
Immunohistochemistry: a protein-level method to see the receptor in place inside tissue
Bulk RNA-seq and Single-cell RNA-seq: RNA-level methods to confirm the gene is actively expressed
Immunohistochemistry
Immunohistochemistry is a molecular “staining” technique. You slice the tissue very thin, place it on a slide, and apply an antibody that binds only to your protein of interest—in this case, LHCGR. A detection system makes the antibody’s binding visible (a colored or brown signal under the microscope). If you see a clean signal in the right cell types and locations, the protein is there.
Antibodies can sometimes bind to the wrong thing — “off-target” binding. To prevent false positives, we included positive and negative controls:
Positive control: a tissue where LHCGR is unquestionably present. You used testis, where LHCGR is well known to be expressed in Leydig cells. We observed strong staining in Leydig cells—as expected—confirming the antibody works.
Internal negative control: in the same testis section, Sertoli cells do not express LHCGR. We saw no staining there, which is exactly what we wanted; it reassures specificity.
With encouraging results from the positive and negative control, we moved on to our tissue of interest: human visceral adipose tissue (VAT) and subcutaneous adipose tissue (SAT). Here, the question was open—does LHCGR show up in fat depots at all?
Using our antibody and a high-sensitivity detection kit, we observed abundant LHCGR staining in adipocytes (fat cells) from both VAT and SAT sections.
IHC tells us that the receptor protein itself is present and where it sits in the tissue. The fact that the signal is in adipocytes (not just surrounding stromal or immune cells) is essential, because adipocytes are the cells that store and release fat. If the receptor is on adipocytes, LH binding to LHCGR can, in principle, directly influence fat cell behavior. Our findings here moves the LHCGR hypothesis from “speculative” to “biologically plausible.”
In short: Immunohistochemistry established protein-level presence of LHCGR in the exact cells that matter for WHR.
Bulk-RNA sequencing
Our next step was to perform bulk-RNA sequencing. Bulk-RNA sequencing essentially can tell which genes are “on” through the amount of mRNA present (since mRNA is produced through the process of transcription by a specific gene. It captures the total mRNA from a collection of cells and then sequences — figures out the exact order of the nucleotides (A, U, C, and G) — that RNA in order to determine which genes were active, or expressed, in those cells. Using high-throughput sequencing machines, a single experiment can capture the expression levels of thousands of genes at once with high accuracy.
RNA-seq experiments generate huge amounts of data, often tens of millions of short sequences. The number of these sequences that match a gene reflects how active that gene is. With the right experimental setup, RNA-seq can identify which genes are expressed when comparing two conditions, such as a treatment group versus normal controls.
If the LHCGR gene is transcribed into RNA in adipose tissue, we will detect it—even across many different donors. This is a powerful cross-check against immunohistochemistry: it asks the same question — is the receptor present? — except at the gene expression level and across large cohorts.
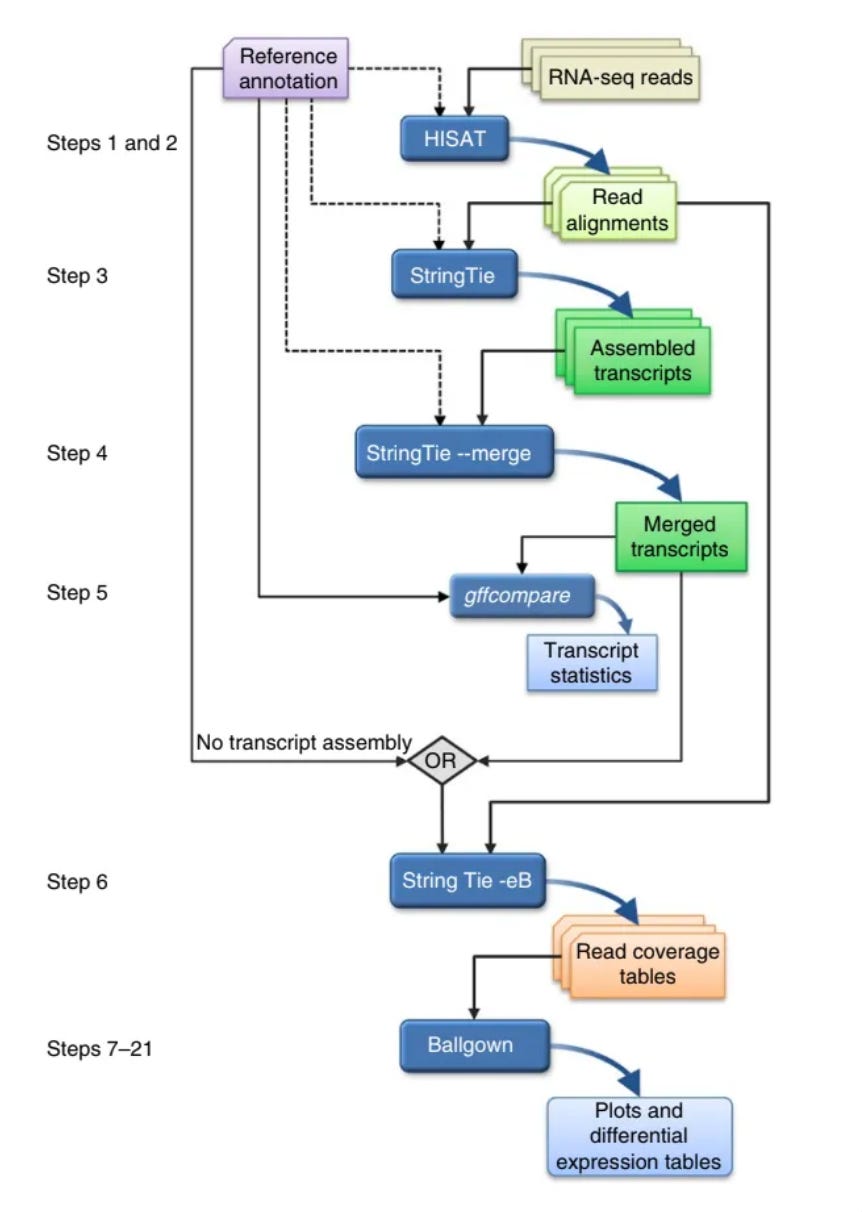
The general steps in RNA sequencing is as follows. I am going to gloss over them, and mention and link some tools that are used in the analysis process. If you are interested just check out their websites to learn more and here is the paper that I followed whilst performing this.
Short pieces of RNA sequences are captured during sequencing (reads) and are then analyzed to produce several useful outputs, including lists of genes, transcripts and expression levels for each sample
Alignment of the reads to the genome
HISAT2 aligns RNA-seq reads to a genome and discovers transcript splice sites —points at which the introns are removed. Introns are a segment of a DNA or RNA that don’t code for proteins, essentially not useful for this experiment.
Assembly of the alignments into full-length transcripts
StringTie assembles/merges the reads as best it can to give you a transcript. StringTie merge compares all of the transcripts to the reference and then aligns all the transcripts to the reference in the best possible way.
The genes and isoforms present in one sample are rarely identical to those present in all other samples, but they need to be assembled in a consistent manner so that they can be compared. We address this problem by merging all assemblies together using StringTie's merge function, which merges all the genes found in any of the samples. Thus, a transcript that was missing an exon in one sample because of a lack of coverage might be restored to its full length.
After assembling with StringTie, the full set of assemblies is passed to StringTie's merge function, which merges together all the gene structures found in any of the samples.
This step is required because transcripts in some of the samples might be only partially covered by reads, and as a consequence only partial versions of them will be assembled in the initial StringTie run. The merge step creates a set of transcripts that is consistent across all samples, so that the transcripts can be compared in subsequent steps.
The merged transcripts are then fed back to StringTie one more time so that it can re-estimate the transcript abundances using the merged structures.
Quantification of the expression levels of each gene and transcript
Calculation of the differences in expression for all genes among the different experimental conditions.
Ballgown takes all the transcripts and abundances from StringTie, groups them by experimental condition and determines which genes and transcripts are differentially expressed between conditions.
We used GTEx (v8)—a canonical public resource with RNA-seq across many tissues and donors. We pulled counts for:
Subcutaneous adipose (both males and females)
Visceral adipose (both males and females)
Positive-control gonadal tissues. Gonadal tissue refers to the gonads which are our primary reproductive organs
Negative-control tissue (e.g., skeletal muscle)
We normalized the counts — which just mean organizing and structuring data in a dataset to reduce redundancy and make it more consistent and accurate — and ran a differential expression framework (DESeq2) to compare across tissues.
We found three main things:
Adipose tissues (VAT and SAT) showed clear LHCGR expression in both sexes.
**Gonads (as expected) expressed LHCGR strongly (**our positive control at the RNA level).
Skeletal muscle showed absent or negligible expression (our negative control at the RNA level).
Bulk RNA-sequencing validates, at scale, that LHCGR isn’t a one-off artifact in a single biopsy—it’s consistently expressed in adipose depots across many individuals. It is also importantly present in both VAT and SAT across both sexes: male and female. Together with immunohistochemistry, this confirms LHCGR is really there in human fat.
In short: bulk RNA-seq established gene-level expression of LHCGR in human adipose across large cohorts, reinforcing the immunohistochemistry result.
Single-cell RNA sequencing
Bulk RNA-seq is an average across all cells in a tissue chunk. Adipose is a mosaic—mature adipocytes, preadipocytes, endothelial cells, immune cells, fibroblasts. If the goal is to modify specifically adipocytes, we need to know which exact cell types express LHCGR. That’s what single-cell (or single-nucleus) RNA-sequencing answers. Single-cell RNA-sequencing can describe RNA molecules in individual cells with high resolution and on a genomic scale.
High resolution = You know which cell type each RNA came from. Thus you know gene expression of every single cell because each mRNA is barcoded.
Genomic scale = Because you are pooling all different cell types that use their genome differently
In plain terms, single-cell RNA sequencing measures gene expression cell-by-cell. After sequencing, cells are grouped into clusters based on their expression profiles (think of clusters as “cell neighborhoods” that share a molecular identity). Known marker genes label each cluster; for adipocytes, a canonical marker is ADIPOQ (adiponectin gene). If LHCGR and ADIPOQ are located in the same cluster, it means mature adipocytes are expressing LHCGR.
We leveraged the Human Adipose Atlas, a high-quality, publicly available single-cell map of human and mouse white adipose tissue. We examined:
The adipocyte cluster (identified by ADIPOQ enrichment).
LHCGR expression within that cluster and across sub-clusters
Whether expression patterns differ by depot (VAT vs SAT) or sex.
We we found:
LHCGR is enriched in the adipocyte cluster that is marked by ADIPOQ—that is, in fat cells rather than just stromal or immune compartments.
This holds across depots and sex
Single-cell data nails down cell-type specificity: adipocytes themselves carry the receptor. The sub-cluster enrichment provides a mechanistic clue: LHCGR is not just anywhere in adipocytes—it’s enriched in subtypes that have been associated with leaner or healthier adipose phenotypes. That aligns with our overall therapeutic idea: turning up LHCGR signaling might shift adipose toward these more favorable cell states.
With these three layers together—Immunohistochemistry (protein in adipocytes), bulk RNA-sequencing (robust expression across many donors and both depots/sexes), and single-cell RNA-sequencing (adipocyte and sub-cluster specificity)—we’ve cleared the most basic but essential hurdle: LHCGR is present in the right cells, in the right tissues, across the right populations.
This matters because target validation is the cornerstone of any translational effort. Before you ask, “Does activating this receptor improve WHR?”, you must answer, “Is the receptor even there, and in the cells that control WHR?” Step 1 answers that with a confident yes.
Step 2 — Do human genetics link LHCGR to fat distribution (WHR)?
Presence isn’t proof of importance. To show that LHCGR matters for WHR, we turn to human genetics. The goal of this step is to move from “the receptor is there” to “changes in this receptor’s expression causally track with WHR.” In other words, does this receptor matter for WHR in real people? This is the kind of evidence we need before testing a drug.
To answer this, I turned to human genetics. The strategy was threefold:
Genome-Wide Association Studies (GWAS): find common genetic variants near LHCGR that are associated with WHR.
Expression Quantitative Trait Loci (eQTL): check whether those same variants change how much LHCGR is expressed in fat tissue.
Colocalization analysis: test whether the same variant is responsible for both the WHR association and the expression change.
If all three lined up, it would provide strong evidence that LHCGR isn’t just present in fat but is actually causally involved in shaping fat distribution.
GWAS: scanning millions of people for clues
A Genome-Wide Association Study (GWAS) is a powerful way to connect DNA variation to traits. The idea is simple: look across the genomes of millions of people, identify small differences in their DNA (called single nucleotide polymorphisms, or SNPs), and ask whether any of these differences consistently show up in people with a particular trait—in this case, a higher or lower WHR.
Most SNPs are harmless “spelling differences” in DNA, but some influence how genes are turned on or off. Importantly, GWAS doesn’t assume we know which genes are relevant. It just scans the entire genome, flagging any regions where genetic variation correlates with the trait.
For this project, I used data from the Type 2 Diabetes Knowledge Portal, which aggregates GWAS results from 31 large datasets, covering nearly 4 million individuals. This is the kind of statistical power you need, because the effect of a single SNP on a trait like WHR is usually very small.
Within the LHCGR region, GWAS identified multiple intronic variants (variations in the non-coding regions inside the gene) that were strongly associated with WHR. Intronic variants don’t change the protein structure, but they often act as regulatory switches, influencing how much of the gene is expressed.
One variant in particular—rs62135431—stood out. It was associated with WHR at a genome-wide level of significance (p = 2.06 × 10⁻¹¹). In practical terms, this means the statistical evidence that this SNP is connected to WHR is extraordinarily strong.
eQTL: connecting DNA variants to gene expression
Finding SNPs linked to WHR is suggestive, but the next step was to ask: do these SNPs actually affect how much LHCGR is expressed in fat?
That’s where expression quantitative trait loci (eQTL) analysis comes in. An eQTL is a genetic variant that changes how strongly a gene is expressed (i.e., how much RNA is made from that gene). Think of it as a dimmer switch: some SNPs turn gene expression up, others turn it down.
For this analysis, I again used GTEx, which provides large-scale RNA sequencing data across human tissues, including both SAT and VAT. By combining genotype data (which SNPs someone carries) with expression data (how much RNA their genes make), it’s possible to see whether a SNP like rs62135431 influences LHCGR levels.
In visceral adipose tissue, rs62135431 behaved as a significant eQTL for LHCGR. Individuals with a genetic variant associated with higher WHR had lower expression of LHCGR in their visceral fat. This relationship held even after adjusting for confounders like age, sex, and ancestry.
In simpler terms: the same SNP that predicts a WHR also predicts lower levels of LHCGR in abdominal fat.
Colocalization: are these the same signal?
Here’s the challenge: just because a SNP is associated with WHR and also affects LHCGR expression doesn’t necessarily mean it’s the same causal variant driving both effects. They could be two nearby signals that just happen to overlap.
To disentangle this, I used colocalization analysis. This is a statistical framework that asks: given the GWAS data (SNPs associated with WHR) and the eQTL data (SNPs associated with LHCGR expression), what’s the probability that the same variant explains both?
Colocalization produces posterior probabilities (PP) for different hypotheses. The one we care about is PP.H4, which represents the probability that there is a single shared causal variant. Values above 0.8 are considered strong evidence.
For rs62135431 in visceral adipose tissue, colocalization analysis showed a 99.99% probability (PP.H4 = 0.999) that the WHR association and the LHCGR expression signal are driven by the same causal variant. This is about as strong as the evidence gets: the statistical fingerprint says that the genetic difference which changes WHR also changes LHCGR expression in fat.
Together, these results move the story forward in a big way:
GWAS told me that common genetic variation near LHCGR is associated with WHR.
eQTL analysis showed that these same variants influence how much LHCGR is expressed in fat.
Colocalization confirmed that it’s the same causal variant doing both.
The biological interpretation is straightforward: lower expression of LHCGR in visceral fat causally contributes to a WHR. This is exactly the kind of human genetic evidence we look for when considering a new therapeutic target. It means that if we could find a way to boost LHCGR signaling in adipose tissue, we might be able to shift fat distribution toward a healthier profile.
Step 3 — Does Turning On LHCGR Actually Change Fat?
By this point, I had shown two key things:
LHCGR is present in human fat cells, especially in adipocyte subtypes tied to healthier profiles (Step 1).
Genetic variation that reduces LHCGR expression increases WHR, suggesting the receptor causally influences fat distribution (Step 2).
The natural next question was: what happens if I flip the receptor “on”? To test this, I turned to a small molecule called Org 43553.
Org 43553 is a synthetic molecule originally developed in reproductive medicine. It binds to LHCGR and activates it—in the same way the body’s own luteinizing hormone would. Unlike hormones like LH, which circulate systemically and can raise sex steroid levels (estrogen, testosterone), Org 43553 is a selective agonist: it activates LHCGR directly without massively altering sex hormone profiles. That makes it ideal for asking the clean question: if I activate LHCGR in fat cells, what happens to fat metabolism itself?
In vitro: testing Org 43553 in fat cells
Before leaping into animals, I started with cell-based systems. These allow precise control over conditions and let me look at fat biology up close.
3T3-L1 cells are a standard mouse cell line used to model fat biology. They start as preadipocytes (immature precursors). With the right cocktail of hormones (insulin, IBMX, rosiglitazone), they turn into mature adipocytes that accumulate lipid droplets, mimicking fat cells in the body. This system is widely used because the cells behave very much like “real” fat cells, and they allow me to test interventions like Org 43553 directly.
I set up this experiment in both a 2D and 3D context to ensure conclusive evidence:
In 2D monolayers, cells grow flat on a dish, where I can measure fat droplet formation, gene expression, and metabolic changes.
In 3D spheroid cultures, cells cluster into rounded structures that more closely resemble mini-fat depots. These spheroids allow me to study how adipocytes organize, accumulate fat, and respond to drugs in a 3D context.
There were three specific outputs we were looking at:
Fat accumulation: measured by staining for perilipin-1 (PLIN1), a protein that coats lipid droplets.
Cell signaling: checked for rapid activation of ERK1/2 phosphorylation, a known signaling cascade triggered by LHCGR.
Energy expenditure: measured oxygen consumption rates (OCR) using a metabolic analyzer, which tells me how much energy cells are burning.
When treated with Org 43553, 3T3-L1 adipocytes showed reduced lipid droplet accumulation. In other words, they stored less fat. ERK1/2 signaling was rapidly activated after Org 43553 exposure, confirming the receptor was being engaged and downstream pathways switched on. Org 43553 also increased oxygen consumption rates, especially after oligomycin challenge (which forces cells to reveal their “spare” energy-burning capacity). This indicated enhanced thermogenesis—the process of burning energy as heat rather than storing it as fat.
These cell-level results showed that activating LHCGR can:
Directly alter adipocyte metabolism, making them less likely to store fat.
Switch on energy-burning pathways, hinting at a mechanism for increasing whole-body energy expenditure.
Importantly, these are direct effects in fat cells, not indirect effects through sex hormones. That distinction is critical if we’re thinking about a therapeutic angle.
In vivo testing in mice
Of course, cell cultures can only tell part of the story. The real question is whether activating LHCGR changes fat distribution in a living organism. For this, I moved to mice.
Male C57BL/6J mice, a standard laboratory strain, were fed a high-fat diet to induce obesity. At 14 weeks old, these mice were randomized to receive either Org 43553 injections or a vehicle control, for nine weeks. This setup mimics the metabolic stress of obesity and lets me see whether Org 43553 can alter fat accumulation under these conditions.
Here were the specific outputs we were looking for:
Total fat mass: measured with quantitative nuclear magnetic resonance (qNMR), which provides a precise readout of lean vs. fat mass.
Adipose tissue weights: dissected and weighed VAT and SAT after treatment.
Histology: VAT sections were fixed, stained (H&E), and analyzed with digital pathology software to quantify adipocyte size distributions.
Here are the results:
Total body fat mass was significantly reduced in Org 43553–treated mice compared to controls.
Visceral adipose tissue (VAT), in particular, was diminished, while subcutaneous fat was relatively preserved. This suggests a depot-specific effect, consistent with shifting fat away from the waist.
Vehicle-treated mice had large, hypertrophic adipocytes—classic hallmarks of metabolically unhealthy fat. Org 43553–treated mice had smaller adipocytes, more closely resembling the profile seen in leaner animals and in humans with healthier WHRs.
These in vivo results provide the first functional evidence that activating LHCGR can remodel fat distribution in a whole organism. The reduction in visceral fat, preservation of subcutaneous fat, and shift toward smaller adipocyte sizes all align with a healthier WHR profile. In essence, Org 43553 treatment made obese mice “carry” their fat more like metabolically healthier humans do—fewer large abdominal fat cells, more balanced fat distribution, and enhanced energy burning.
With these experiments, I moved from association (Steps 1 & 2) to causation: activating LHCGR directly changes fat metabolism and fat distribution.
In cells, Org 43553 reduced fat storage and increased energy expenditure.
In mice, Org 43553 reduced visceral fat, shifted adipocyte size distributions, and produced histological profiles matching healthier WHR patterns in humans.
This is exactly the kind of evidence needed to nominate LHCGR as a therapeutic target for obesity—not just for weight loss, but specifically for improving waist-to-hip ratio, the most predictive marker of long-term health risk.
Summary
When I began this work, the guiding question was simple but ambitious: could LHCGR, traditionally viewed as a reproductive receptor, also be a regulator of fat distribution? Answering that required moving step by step, layering evidence from different angles until a clear picture emerged.
Step 1 — The receptor is present in fat
First, I needed to prove LHCGR actually exists in human adipose tissue. Using immunohistochemistry, bulk RNA-seq, and single-cell RNA-seq, I established that LHCGR is expressed in mature adipocytes, not just accessory stromal cells. Even more compelling, LHCGR expression was enriched in adipocyte subtypes associated with lower BMI and healthier metabolic states. This suggested that the receptor is not just present but potentially functionally relevant.
Step 2 — Human genetics link LHCGR to WHR
Next, I turned to genetics. Through a meta-analysis of nearly 4 million individuals, GWAS revealed that common variants near LHCGR are strongly associated with WHR. The lead SNP, rs62135431, was then shown by eQTL analysis to reduce LHCGR expression in visceral fat. Colocalization analysis sealed the case: the same variant that lowers receptor expression is the one that raises WHR, with a posterior probability of 99.99%.
Step 3 — Activating LHCGR changes fat biology
Finally, I asked whether LHCGR could be functionally manipulated. By using Org 43553, a selective agonist, I showed that turning on the receptor changes fat biology. In adipocytes, Org 43553 reduced lipid storage and boosted energy expenditure. In mice, it selectively reduced visceral fat, preserved subcutaneous fat, and remodeled adipocyte size toward a profile resembling humans with lower WHR. These changes aligned perfectly with the genetic evidence: higher receptor activity favors healthier fat distribution.
Taken together, these steps form a cohesive argument.
The receptor is present in the right cells.
Genetic variation in its expression alters WHR.
Pharmacological activation shifts fat distribution in the predicted direction.
Thank you for reading and I really hope you enjoyed this article. If you want to look at the paper, which is admittedly very jargon-heavy, it is here. Finally, here is also a link to my poster that synthesizes my work in a different format, though it is also a bit confusing.